Photometry
Measuring the light of stars, frame after frame, to see what changes: a pulsating star, or a planet passing in front of its star.
What is photometry?
You take a long series of exposures of the same field. On each frame, you measure the light of the star under study (the target) inside a small circle, the aperture, minus the sky background around it.
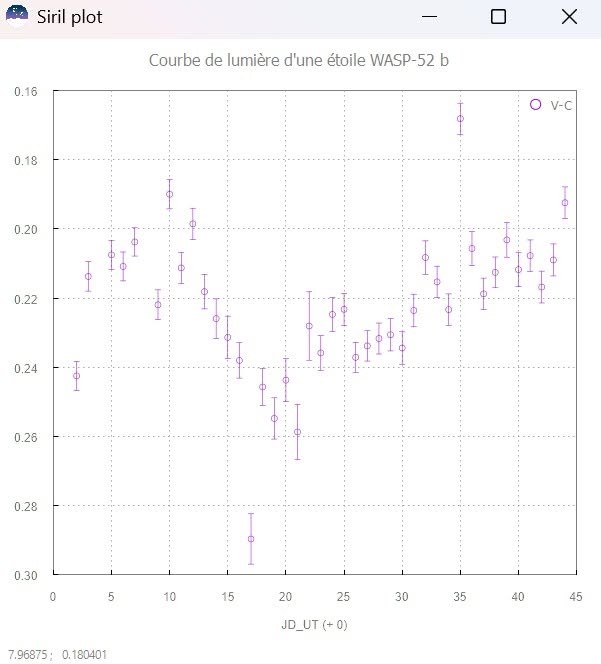
That measure alone is worthless: the atmosphere keeps changing (altitude, haze, clouds). So you also measure stable comparison stars in the same field. The target / comparison ratio, or the magnitude difference (V − C), cancels what the atmosphere does to all stars at once. Only what the target does remains.
Plot this ratio against time and you get the light curve.
A variable star: AE UMa
AE UMa is a high-amplitude Delta Scuti pulsating star. It swells and shrinks in just over two hours.
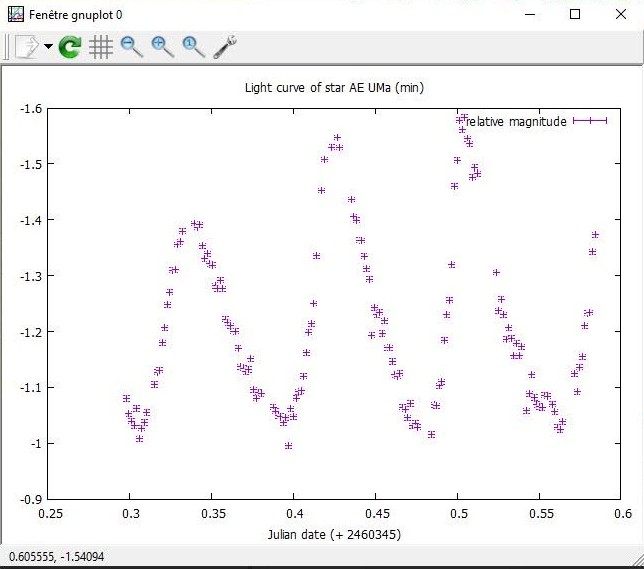
The curve shows a period of about 0.086 day (≈ 2 h 04 min) and an amplitude of about 0.5 magnitude. The maxima do not all reach the same height: AE UMa pulsates in two modes at once, which add up.
An exoplanet: the transit of WASP-52 b
WASP-52 b is a gas giant orbiting its star in 1.75 days. When it passes in front, it hides a little over 2 % of the star's light for about 1 h 50 min. That small dip is what we are after.
The raw measure
Fitting a model
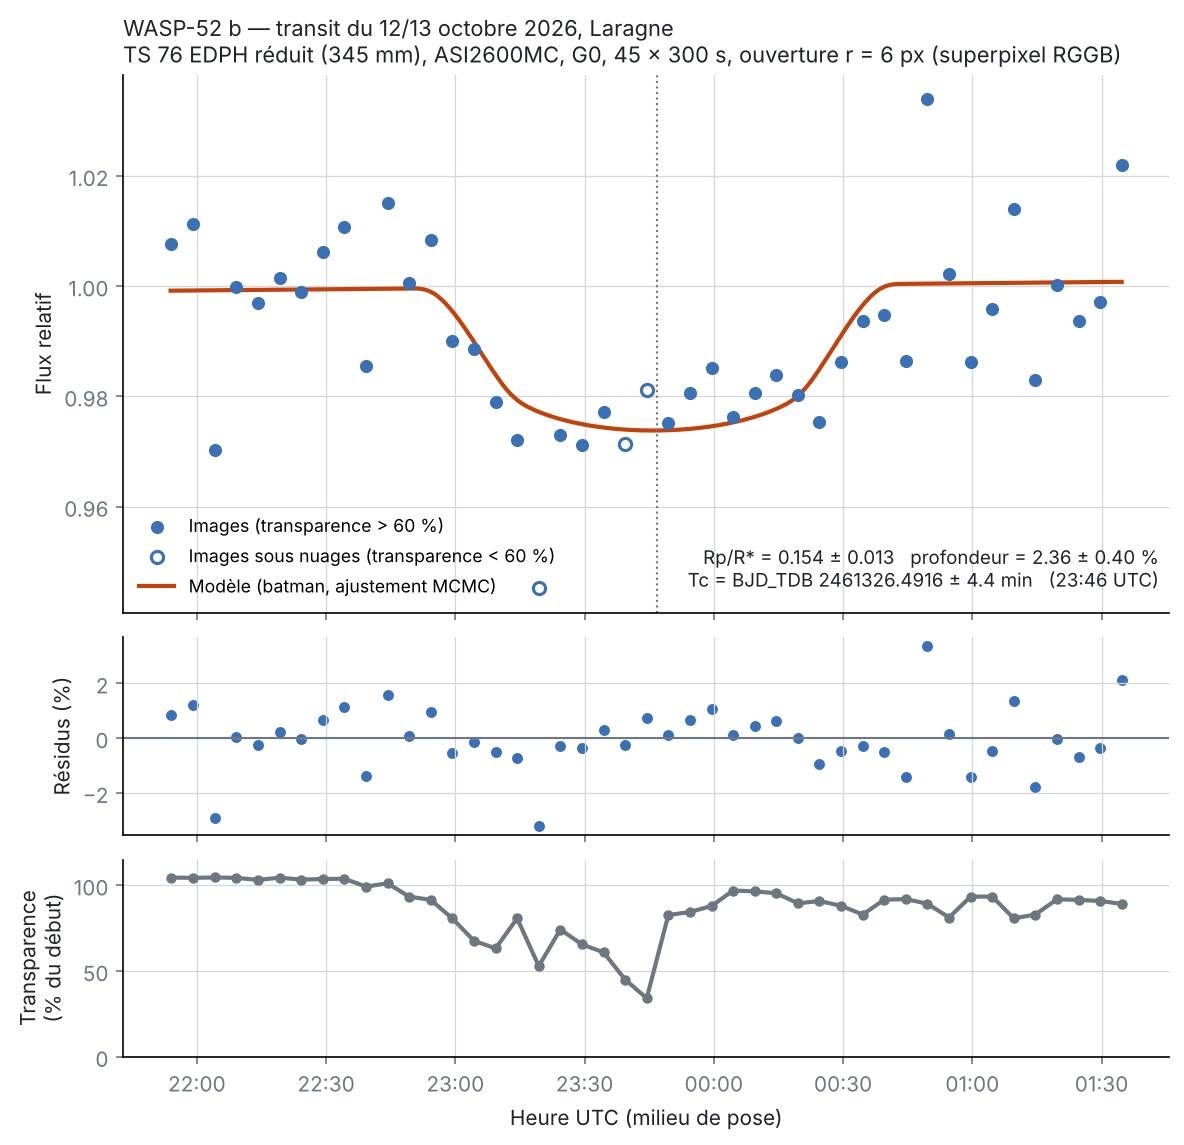
The model gives a planet radius of 0.154 ± 0.013 times the star's, i.e. a depth of 2.36 ± 0.40 %, and mid-transit at 23:46 UTC (± 4 min). Published values (about 0.164 and 2.7 %) are within about one standard deviation: consistent.
The bottom panel shows why some points stray: around 23:30 UTC, clouds pulled the transparency below 60 %. Those frames are shown as open circles.
Equipment and processing
- TS 76 EDPH refractor with reducer (345 mm focal length), ZWO ASI2600MC camera.
- Acquisition: N.I.N.A. For WASP-52 b: 45 exposures of 300 s, gain 0.
- Photometry: done by Michel with the Siril photometry tool (6 px aperture, RGGB superpixel); this gives the raw curve.
- Transit model: batman, MCMC fit done by Claude (Anthropic) from the Siril measures.